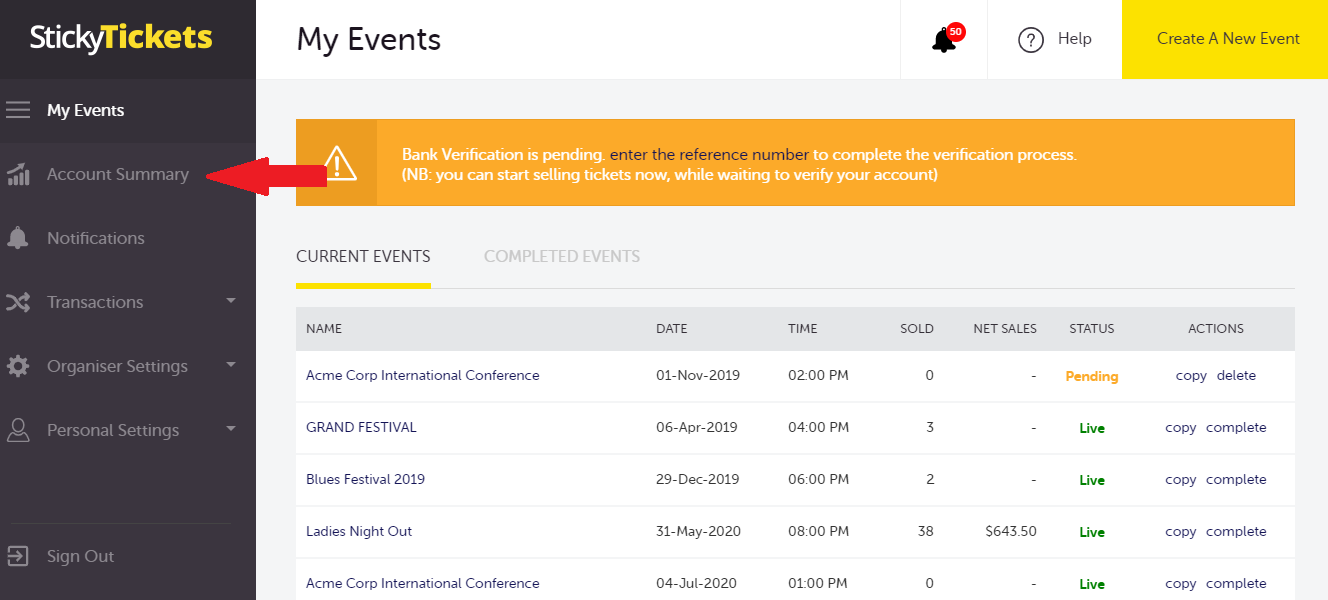
1. Login to your Sticky Tickets account. Click on Account Summary.
2. Select a report range from the dropdown menu.
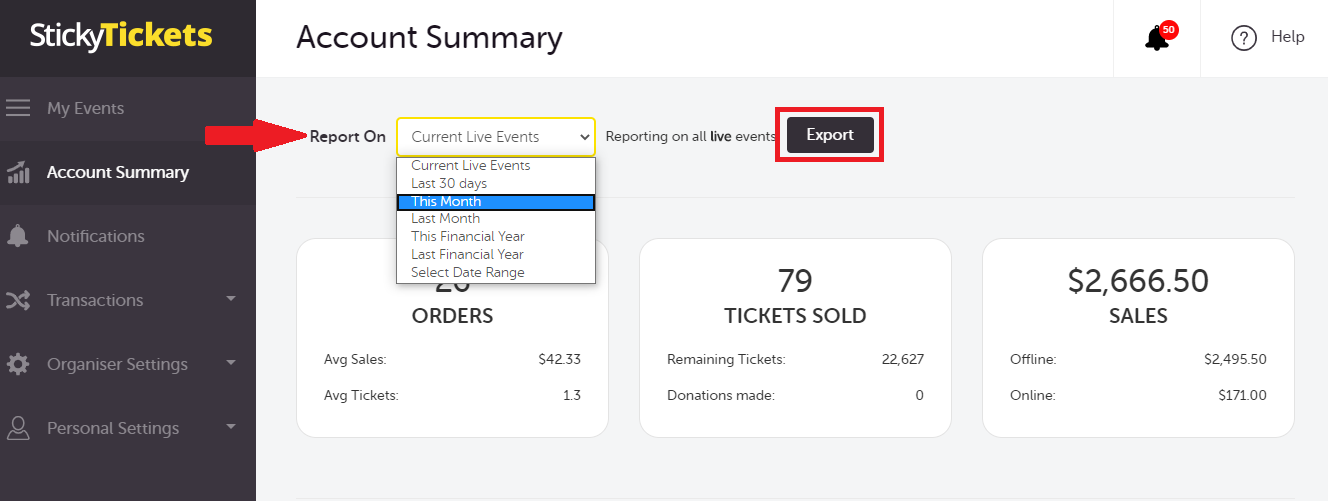
The generated report will list the following
- Total Orders - Average sale per order - Average tickets sold per order
- Total Tickets Sold - Total remaining tickets for sale - Total donations made
- Total Net Sales - Total offline sales - Total Online sales
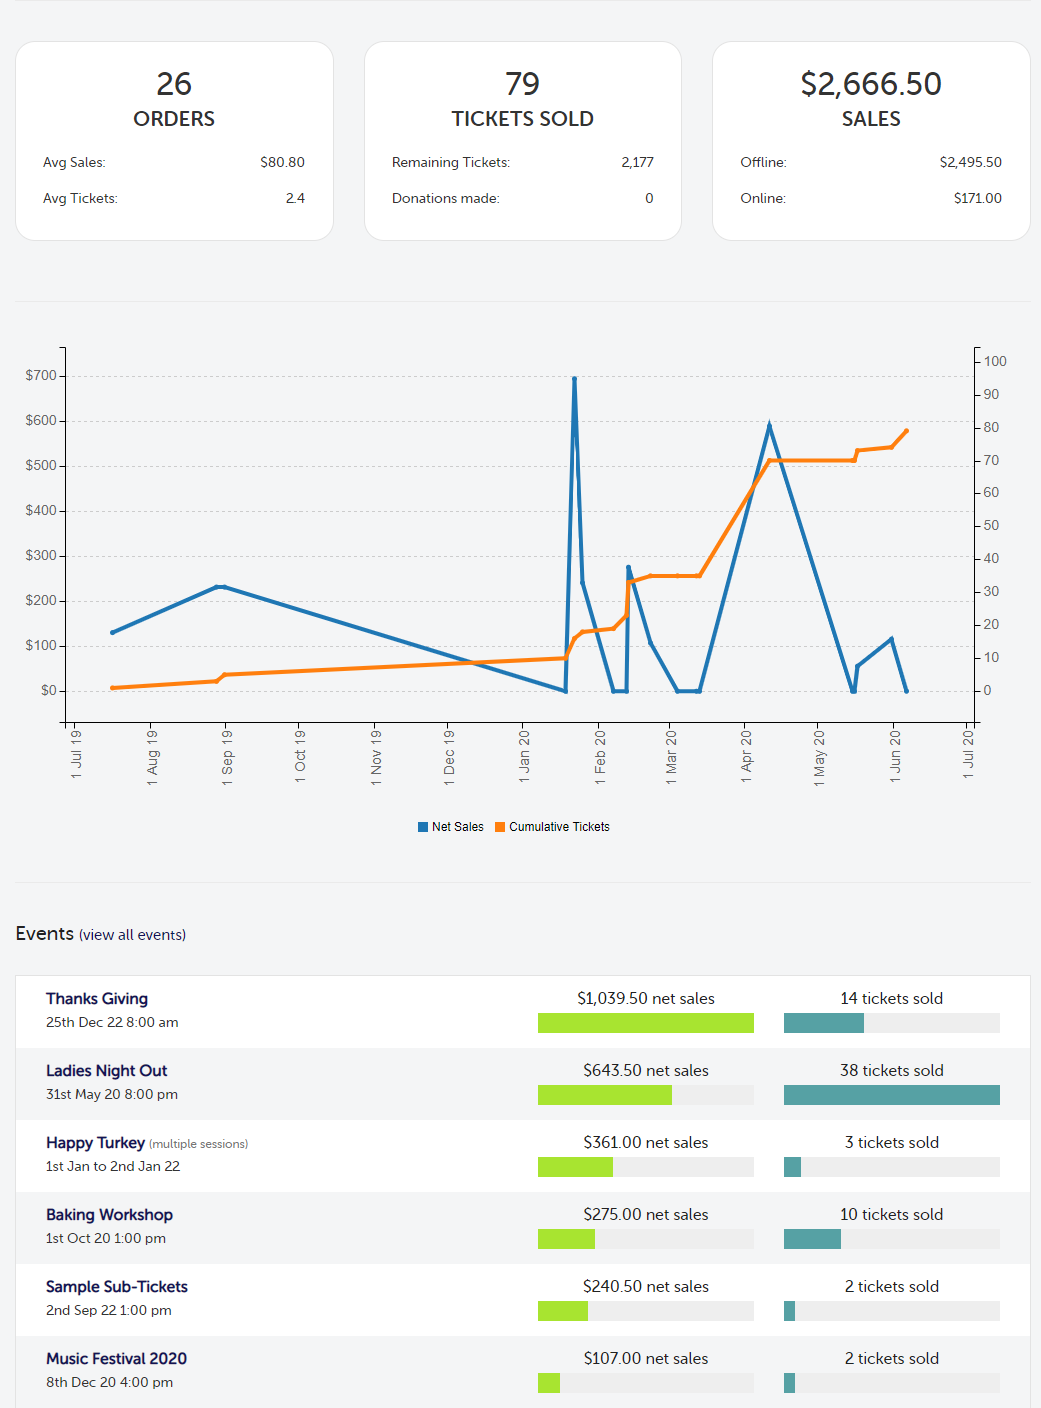
- Net Sales
- Cumulative Tickets Sold
Note: you can hover your cursor over the graph to get totals for a specific date
If you have any questions about accessing reports for your event or anything else, please do not hesitate to contact us anytime, and we'd be more than happy to help.